![[Artist's Concept of AXAF]](/images/axmicro.gif)
![[Artist's Concept of AXAF]](/images/axmicro.gif) |
CXO Project Science:
|

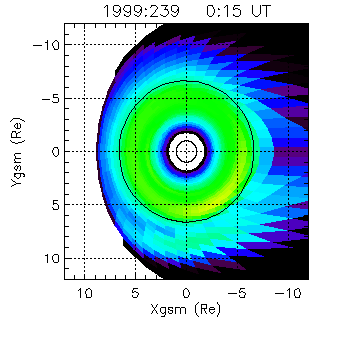
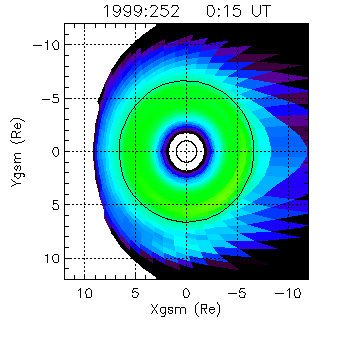
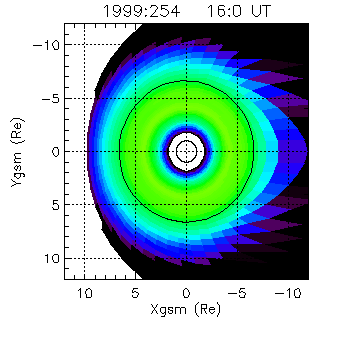
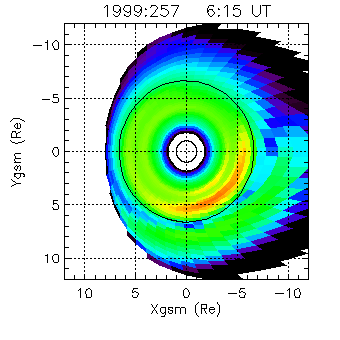
Table of perigee day and the time of the MSM run closest to perigee, for the 8 perigee passes during which ACIS was not protected and for the day-286 "event". The next columns are the estimated log of the peak proton spectral intensity --- p/(cm^2 sr^1 MeV^-1) at 0.1 MeV --- for -2h, -1h, 0h, +1h, and +2h from perigee, followed by the average for these 5 hours nearest perigee. The final 2 columns compare the MSM peak with the AP8MAX peak, the former being the log of MSM/AP8MAX, the latter being MSM/AP8MAX.
 |
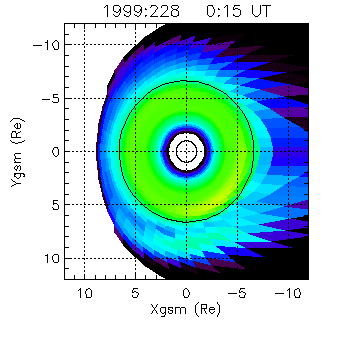
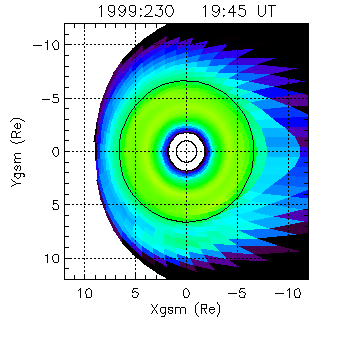
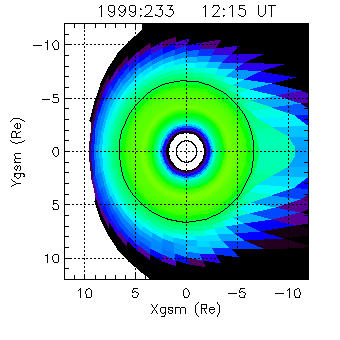
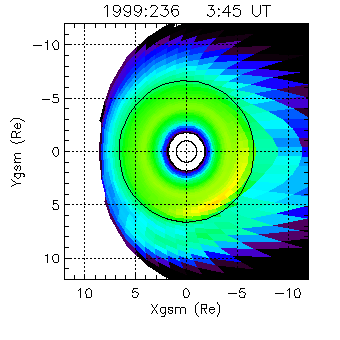
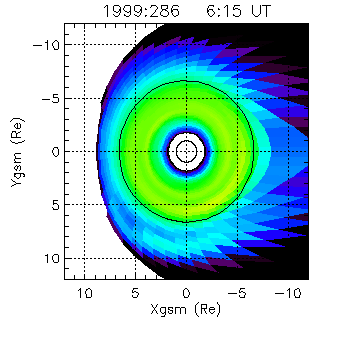
Short animations, accessed by selecting thumbnail gifs, comprise 1-hour intervals per image and extend no more than about 8-hours from perigee. Long animations are 15-minute intervals per image and include the full dataset as generated by Terry Onsager ( NOAA/SEC):
|
|
|
| Perigee Day: 228 | Perigee Day: 231 | Perigee Day: 233 |
| Long Animation 228 | Long Animation 231 | Long Animation 233 |
|
|
|
| Perigee Day: 236 | Perigee Day: 239 | Perigee Day: 252 |
| Long Animation 236 | Long Animation 239 | Long Animation 252 |
|
|
|
| Perigee Day: 254 | Perigee Day: 257 | Perigee Day: 286 |
| Long Animation 254 | Long Animation 257 | Long Animation 286 |

Return to our ACIS page, go to the Chandra Project Science Page or to X-ray Astronomy at MSFC
|
Editor: Dr. Douglas Swartz System Administrator: Mr. Bob Dean Privacy Policy and Important Notices Accessibility Statement |

|
|