![[Artist's Concept of AXAF-I]](/images/axmicro.gif) AXAF Project Science: Ti-K spot sizes
AXAF Project Science: Ti-K spot sizes![[Artist's Concept of AXAF-I]](/images/axmicro.gif) AXAF Project Science: Ti-K spot sizes
AXAF Project Science: Ti-K spot sizes
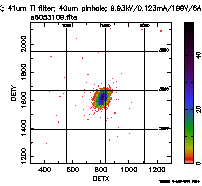
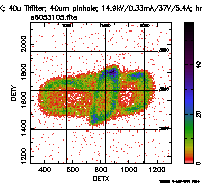
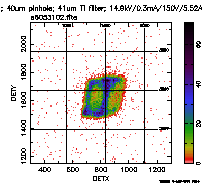
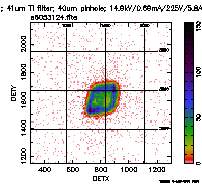
Here are the images of Ti-K spot from the EIPS at XRCF. The overlay grid has a spacing of 500 microns (0.5 mm). The GIF images are only for part of the total FITS image. For the higher voltages there is some punch-through which shows up as enhanced background in a circle centered on the pinhole image. (The GIF images are entirely inside this circle.)
Integration time  = 300 sec
Filter            = 41 microns Ti
Magnification     = 3.59
Data taken        = 1996-05-31

VHRIFIT           = 1998-02-26
GAPFIL            = sumb.gap
VLEXTRCT          = 1998-02-26
| Source | Bias | Beam | Filament | Fits data | Thumbnail GIF |
| (kV) | (V) | (mA) | (A) | ||
| 0.0 | 0 | 0 | 0 | FITS image |
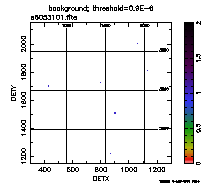
|
| 5.96 | 15 | 1.68 | 5.68 | FITS image |
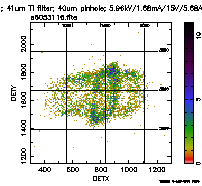
|
| 6.00 | 60 | 0.84 | 5.72 | FITS image |
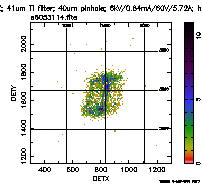
|
| 5.96 | 60 | 1.69 | 5.90 | FITS image |
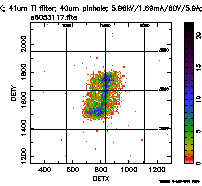
|
| 5.96 | 89 | 0.97 | 6.00 | FITS image |
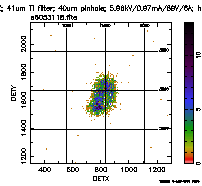
|
| 5.99 | 104 | 0.45 | 6.00 | FITS image |
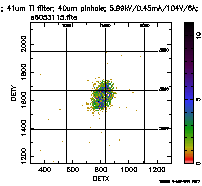
|
| 5.96 | 104 | 0.40 | 6.00 | FITS image |
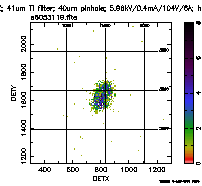
|
| 7.74 | 19 | 0.65 | 5.50 | FITS image |
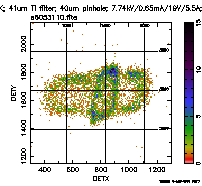
|
| 7.45 | 19 | 1.34 | 5.62 | FITS image |
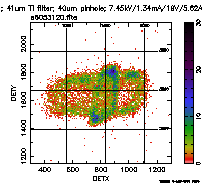
|
| 7.45 | 75 | 0.66 | 5.66 | FITS image |
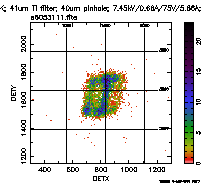
|
| 7.45 | 74 | 1.34 | 5.82 | FITS image |
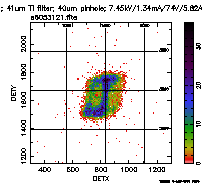
|
| 7.45 | 112 | 1.13 | 6.00 | FITS image |
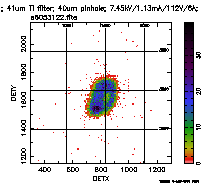
|
| 7.45 | 130 | 0.546 | 6.00 | FITS image |
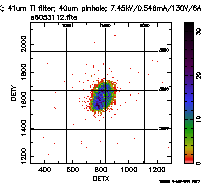
|
| 7.50 | 130 | 0.51 | 6.00 | FITS image |
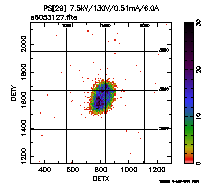
|
| 7.45 | 149 | 0.096 | 6.00 | FITS image |
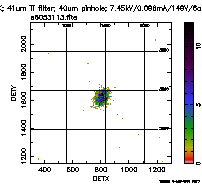
|
| 9.93 | 25 | 0.50 | 5.46 | FITS image |
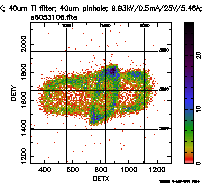
|
| 9.93 | 99 | 0.51 | 5.61 | FITS image |
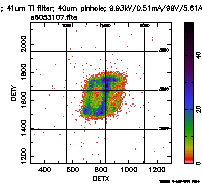
|
| 9.93 | 149 | 1.02 | 5.92 | FITS image |
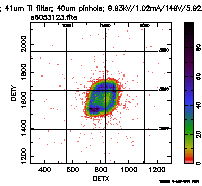
|
| 9.93 | 174 | 0.51 | 5.90 | FITS image |
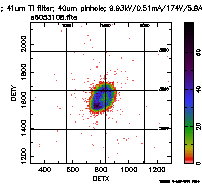
|
| 10 | 174 | 0.64 | 6.00 | FITS image |
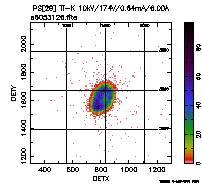
|
| 9.93 | 199 | 0.123 | 6.00 | FITS image |
|
| 14.9 | 37 | 0.33 | 5.4 | FITS image |
|
| 14.9 | 150 | 0.30 | 5.52 | FITS image |
|
| 14.9 | 225 | 0.69 | 5.80 | FITS image |
|
| 14.9 | 260 | 0.32 | 5.75 | FITS image |
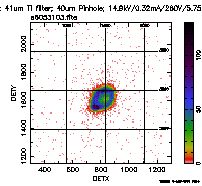
|
| 14.9 | 298 | 0.18 | 6.00 | FITS image |
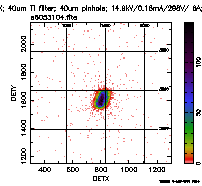
|
| 0 | 0 | 0 | 0 | FITS image |
|
|
Editor: Dr. Douglas Swartz System Administrator: Mr. Bob Dean Privacy Policy and Important Notices Accessibility Statement |

|
|