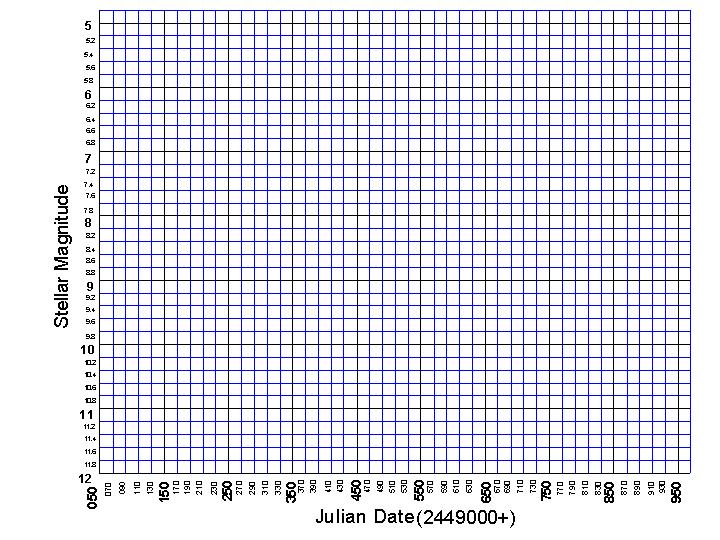
Chandra X-ray Observatory - Home About The Chandra Educational Materials Field Guide Photo Album Press Room Resources
Chandra X-ray Observatory - Home Educational Materials - You are here
Observatory Classroom-Ready Activities Background Info Interactive Games Printable Materials Education Links & Resources Search


Visit the Chandra Chronicles

Recording Stellar Heartbeats

To determine if the variable star that you have "observed" has a regular cycle, you will need to plot your observations on a graph and analyze the resulting light curve. Graph paper that can be used has been provided for you. Click on image below and print. On the graph paper plot your magnitude estimations from the table onto the graph.

Plot


Study the resulting light curve. Does this variable star show periodic behavior? Is this the light curve for a Cepheid variable star?

Return to Variable Stars Index


  separator line
CXC Home | Public Info & Education | Search | Help | Site Map | Image Use | Privacy
New & Noteworthy | Guestbook | Multimedia | Ecards | Glossary | Q&A | Web Awards


  [News by email: Chandra Digest]
[Contact us: cxcpub@cfa.harvard.edu]
NASA's Home Page Smithsonian's Home Page CXC Home Page Image Map for NASA's, Smithsonian and Chandra's Home Pages
  Harvard-Smithsonian Center for Astrophysics
60 Garden Street, Cambridge, MA 02138 USA
Phone: 617.496.7941 Fax: 617.495.7356
Operated for NASA by SAO
This site was developed with funding from NASA under Contract NAS8-39073.
Revised: 07/14/03